
While having a compelling product vision and following your gut instinct are essential as a startup founder, if you are not also tracking data, you are going to be in for a rough ride.
Analytics and data can help you steer your business in the right direction and avoid costly hurdles and obstacles.
However, you don’t need to overcomplicate it and spend hours each week pouring over data in spreadsheets. Instead, implementing the lean analytics framework, popularized by serial entrepreneur and public speaker Ben Yoskovitz, can give you all of the insights you need in a fraction of the time.
In this post, we’re taking a closer look at the lean analytics framework, how to implement it, and how it can help you go from idea to viable product.
Why is lean analytics so important?
When you are launching your business, you as the entrepreneur need to have a strong and compelling vision, or else you’d struggle to get started.
However, one of the downsides of that is it is easy to lie to yourself. The reality distortion field is strong as you go from idea to product.
That’s where analytics and data can act as the perfect checks and balances. After all, the purpose of analytics is to help you initially reach product-market fit and also not run out of money.
Some additional benefits to implementing the lean analytics model are:
Improved focus - You can’t manage what you don’t measure. This will help you stay focused and eliminate distractions / shiny objects.
Better decision-making - Data is everywhere. The key is to learn how to analyze it to make improved recommendations.
Analyze experiments - You are going to run a lot of experiments. The key is to learn and get actionable advice from each one.
Keep yourself honest and accountable - When you are reviewing key metrics regularly, it becomes much harder to lie to yourself about what’s happening in the business.
What is a lean startup?
The Lean Analytics model is derived from the lean startup model, first coined by Eric Ries.
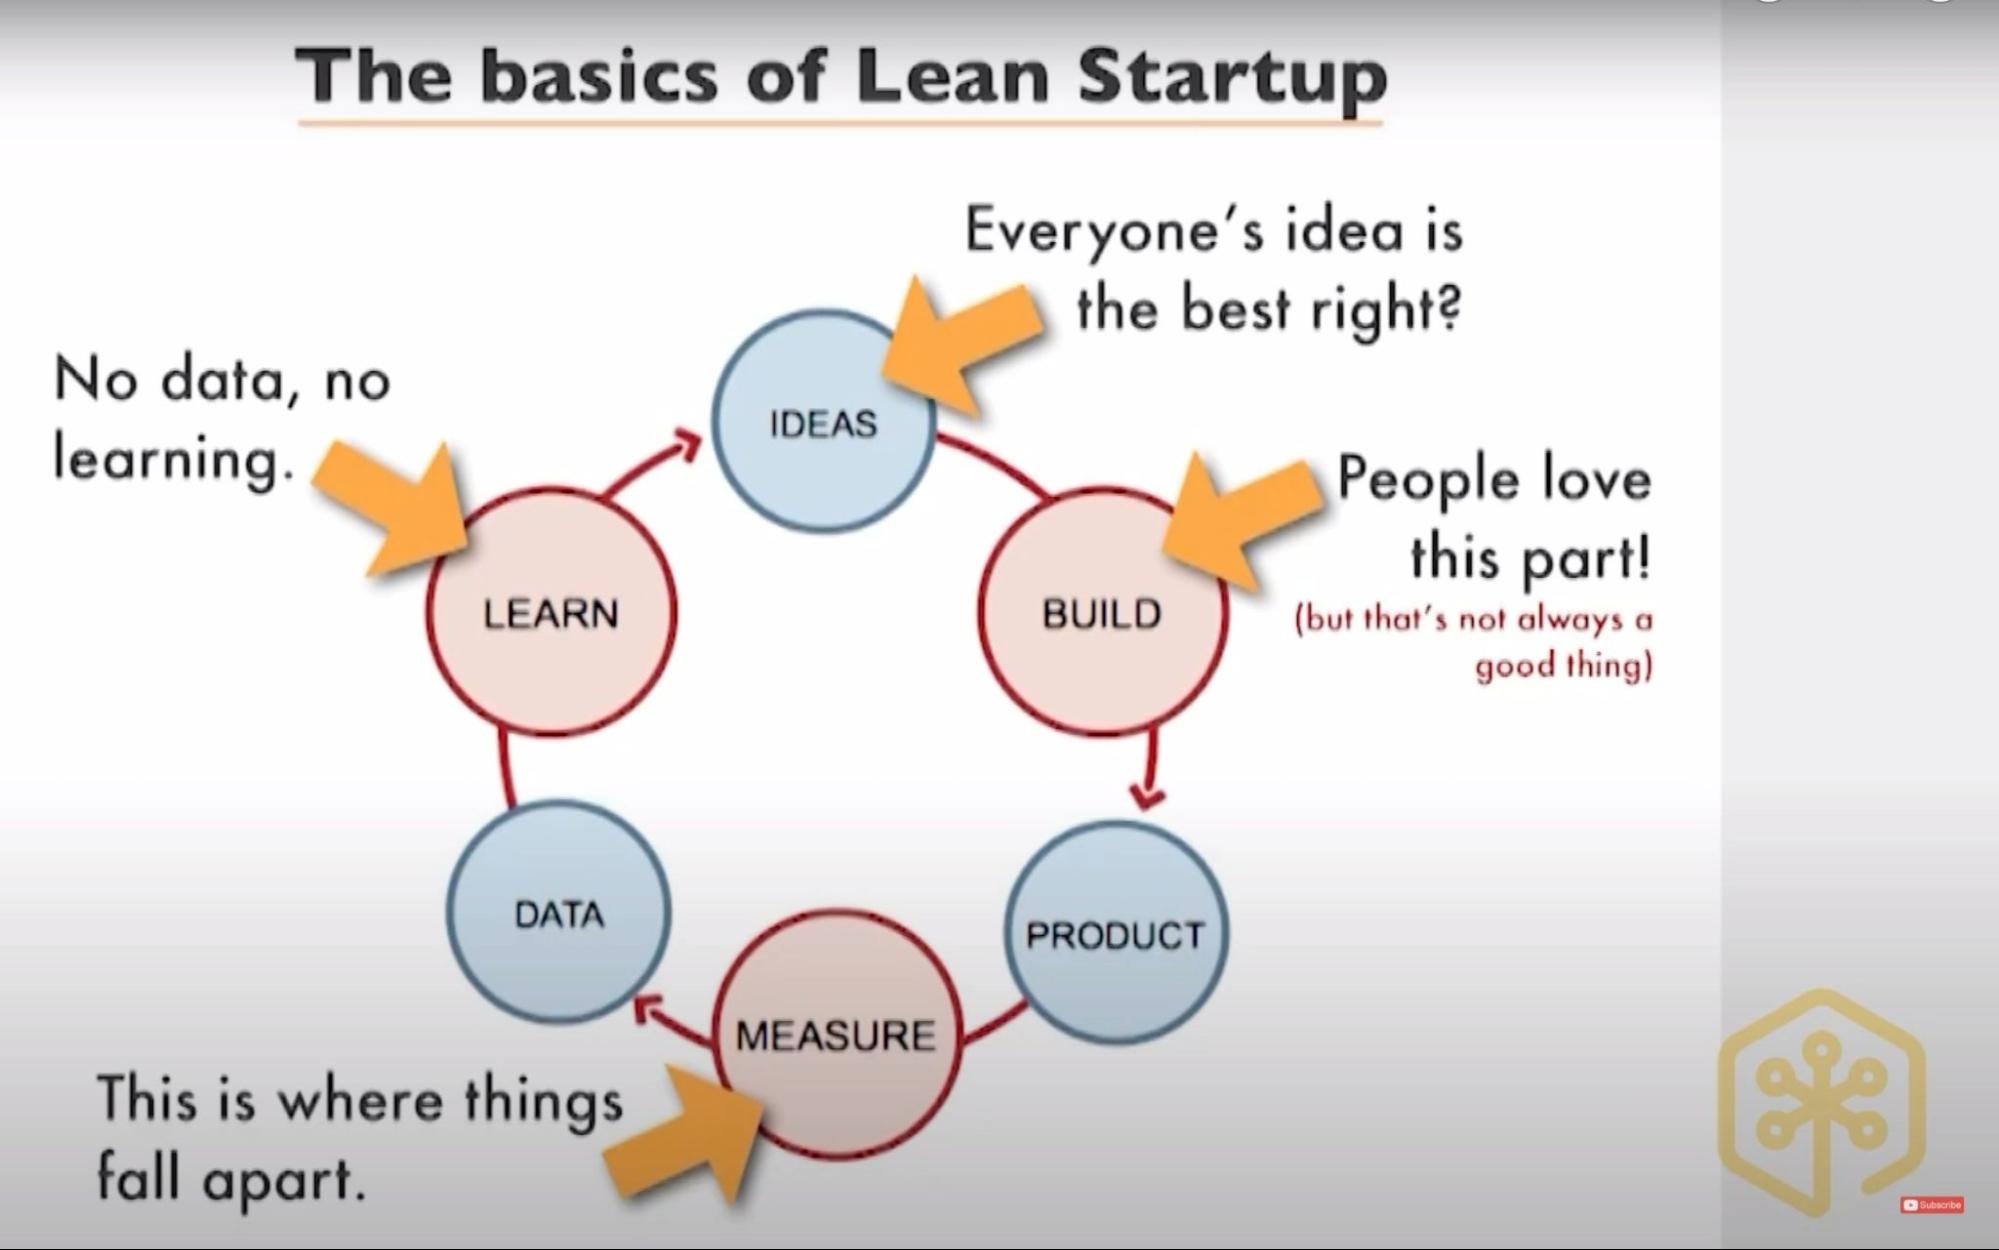
The basics of a lean startup are the following:
Start with an idea.
Build a MVP product
Create KPIs and measure.
Learn and apply the insights.
What is the lean analytics framework?
The lean analytics framework applies this same methodology, but for what you should measure.
As we alluded to earlier in this post, data is readily accessible. However, if you try to measure everything, you either get overwhelmed by analyzing all of it, or you’ll abandon data altogether and go back to using your gut intuition.
A better alternative and the core of this framework is to find the one metric that matters. At any given moment in your business, there is a single metric that matters more than anything else to drive results.
This metric can and will change based on the stage you are at in your business.
For example, this metric might be revenue growth, engaged visitors, customer acquisition cost (CAC), monthly churn rate, free to paid customer, paid load time, customer lifetime value (CLTV), etc.
Let’s use the example of paid churn.
If this is your one metric that matters the most right now and churn is decreasing, you might ask the following questions:
Was a recent marketing campaign successful?
Were customer complaints lower?
Did you roll out a new feature that many customers viewed as valuable?
What makes a good metric?
So, when you are thinking about the one metric that matters the most in your business, it is important that this metric has the following criteria.
Understandable - The metric should be easy to follow. For instance, increased trial sign-ups from last week is more meaningful than a 5% conversion.
Ratio / Rate - Good metrics are comparative, and it changes the way you behave.
Qualitative vs. Quantitative metrics - Know the difference between the two and when to use each one. Quantitative data is hard facts, like numbers. Qualitative data is unstructured and anecdotal.
Vanity vs. actionable metrics - Vanity metrics, like follower count, new subscribers, page views, etc, might make you feel good, but they aren’t tied to core business KPIs. Actionable metrics, like revenue, churn, etc, on the other hand, help you pick a direction.
Lagging vs. leading indicators - Just like you need a balance of qualitative and quantitative metrics, you also need both lagging and leading indicators. Lagging metrics are historical metrics that show you how you’re doing. Leading metrics are the number today that shows a metric tomorrow.
When you have the right mix of metrics, you can gain analytical superpowers by being able to make causal inferences.
Causal inferences are an independent variable that directly impacts a dependent one. This lets you change / rewrite the future.
Pro Tip: You want to test that this is in fact a causal inference and not simply correlated. A correlated factor is when two things may be related, but there is something else happening in the background.
Lean Analytics Stages

Now that you understand the basic lean analytics framework, here is how you can actually put this into practice for a SaaS company.
This is the typical SaaS customer lifecycle. (See above image.)
You typically go through these distinct growth stages, where you start off slow as you are validating the product (i.e. the empathy and stickiness stages in the chart below).
Then, you hit virality, where you’ve unlocked the right product and features that keep people around.
Once you hit product-market fit (or what is referred to as “revenue” in the chart below), you are ready to scale. You no longer just have a product, but you have a real business that can scale.
Pro Tip: Best-in-class SaaS companies are able to grow revenues per customer by 20% from year to year.
Then, you slow down again as you become a big company, and inertia and market saturation kick in.
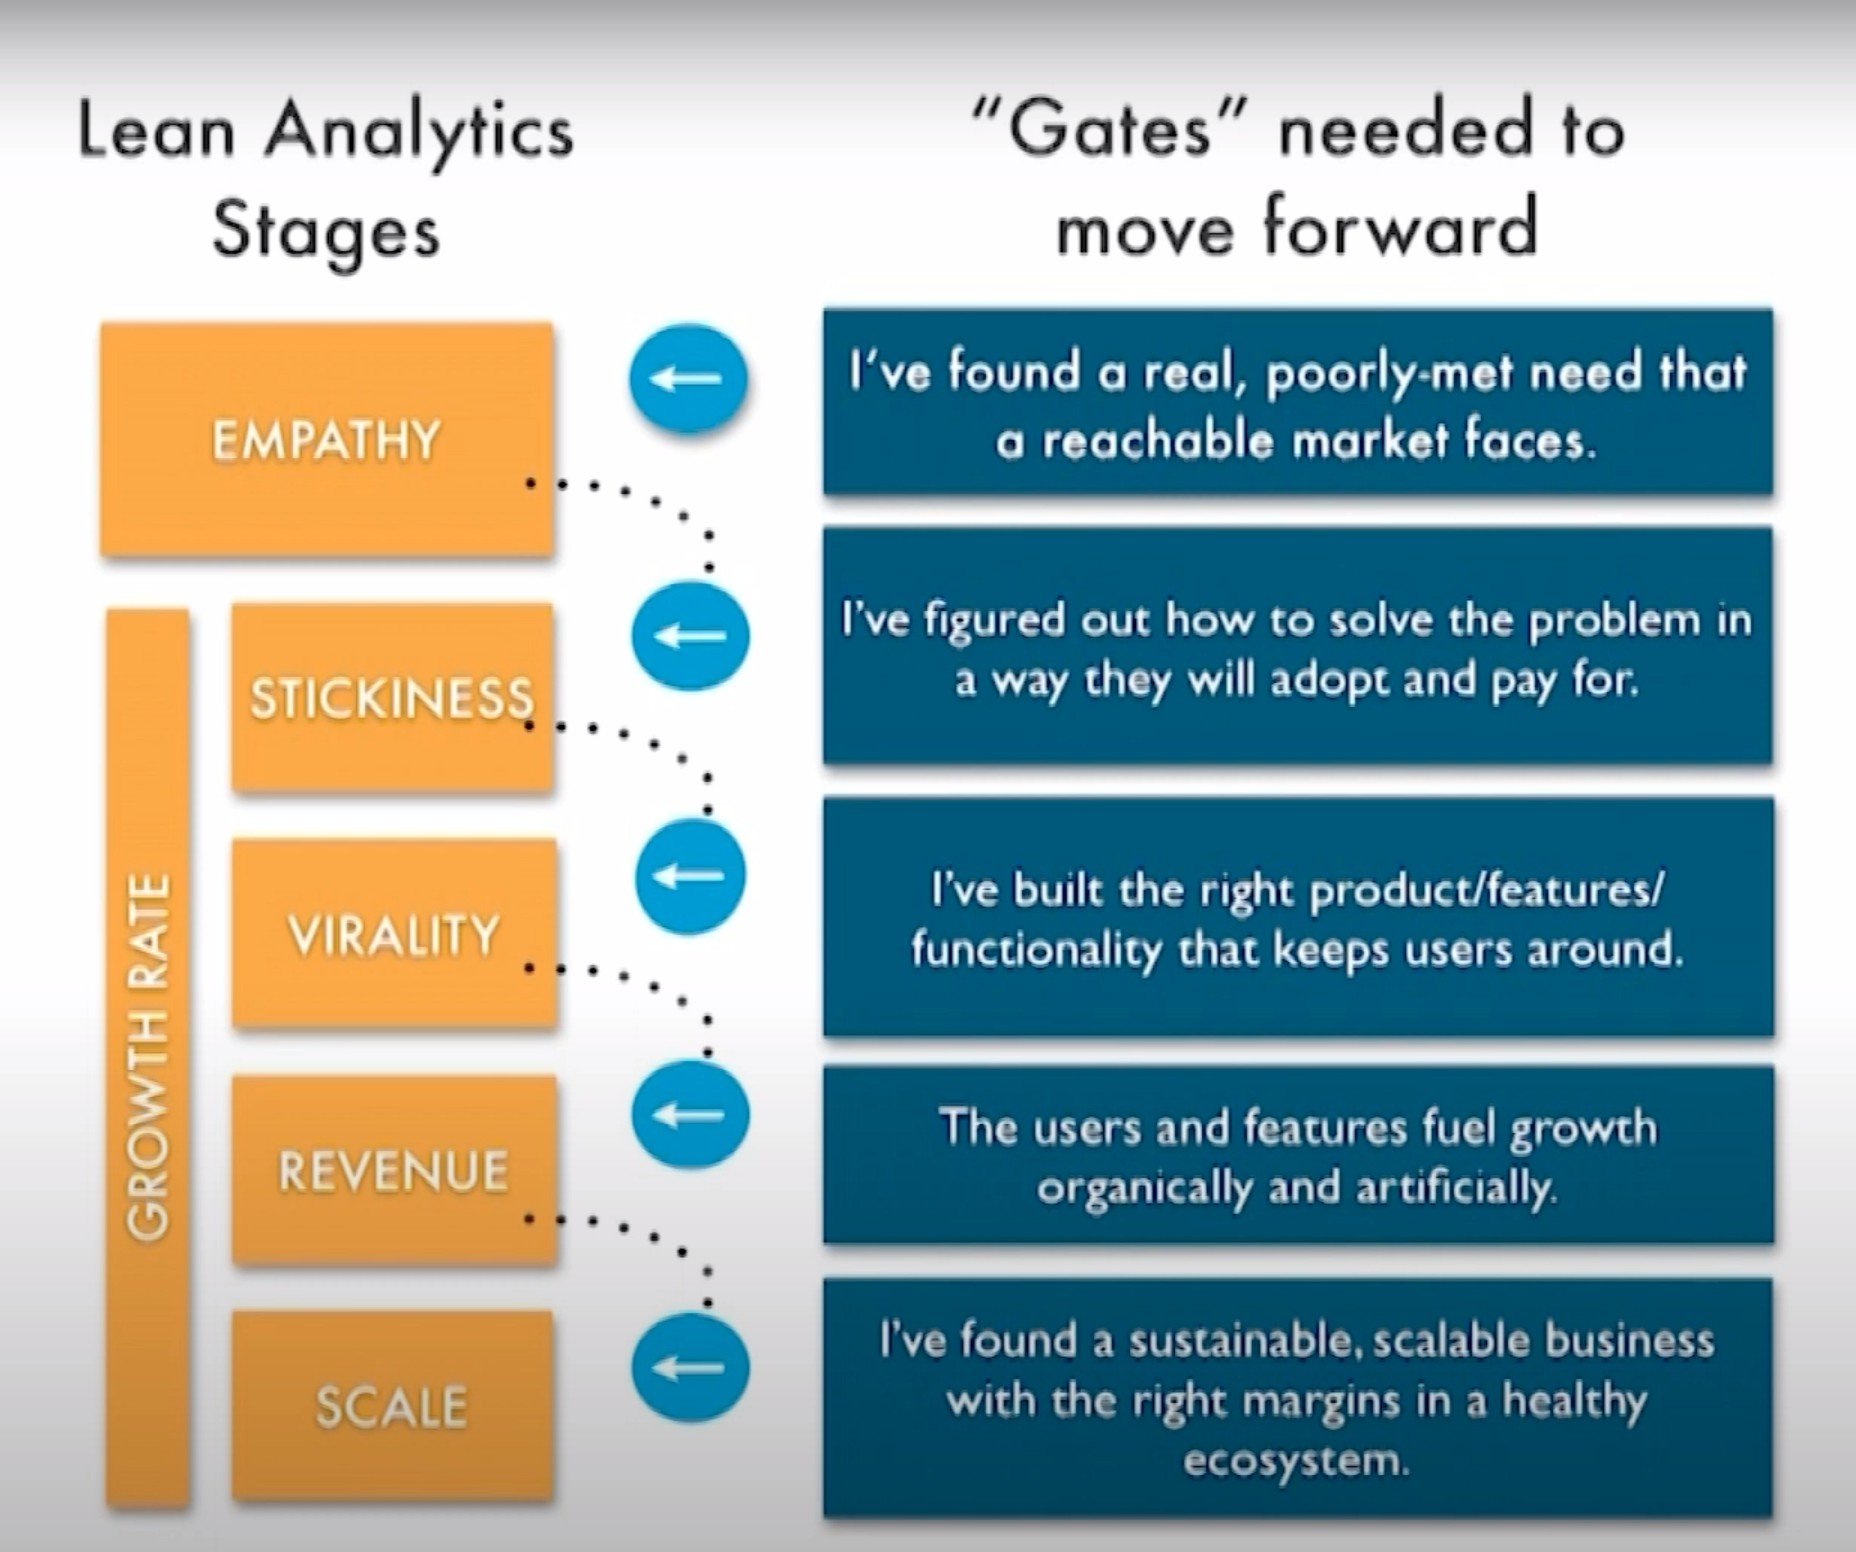
At each of these lean analytics stages, you’ll repeat the lean analytics framework. This means identifying the key business problem, picking the right metric that matters for the stage you are in, drawing a line in the sand, and getting to work.

***
In sum, implementing the lean analytics framework saves you time and provides necessary checks and balances, so you aren’t running solely on gut feelings.
This can help you reach product-market fit and scale faster while identifying and course-correcting potential problems before they snowball.
Want to learn more about the lean analytics framework? Watch this talk in the MicroConf Video Vault?
