
Every week, we turn people’s data questions into crypto bounties for data analysts to solve.
We’ve got six spectacular Compound data dashboards to show you this week, focusing on everything from the typical Compound user to the recent volatility in the market.
So what did our intrepid team of bounty hunters find out?
Typical Compound users
To learn more about the typical Compound user, @scottincrypto looked at a few different questions, including how many addresses have supplied to more than one Compound market over the past month. As we can see below, only a small percentage of users have deposited into multiple unique markets.
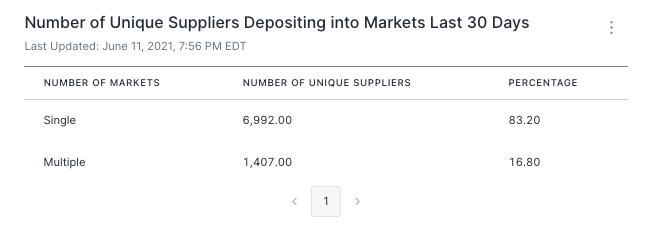
Check out Scott’s Compound data here, where he also answers other questions, including how many have borrowed from more than one market, how many have done both, and more.
Lending and borrowing rates
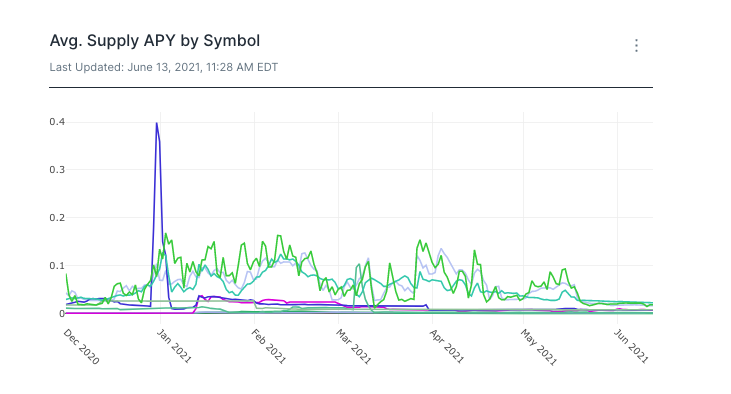
Andruu examined the borrowing and lending rates on Compound. More specifically, Andruu was after how exactly those rates are determined.
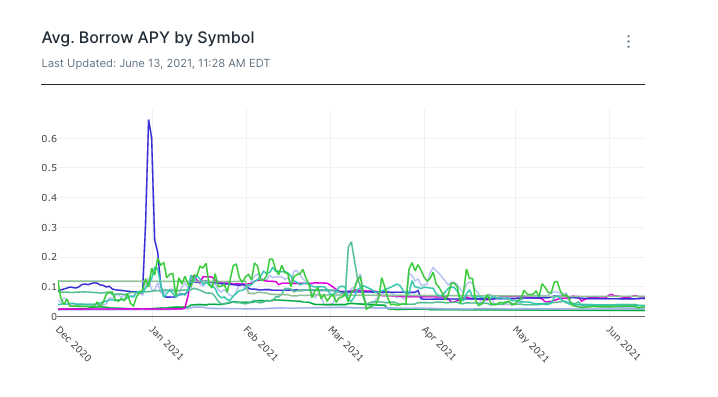
As we can see below, borrow APYs tend to become less volatile and near-equilibrium over time. Supply APY, meanwhile, tends to track borrow APY but is level shifted down. The result is a supply APY that equals borrow APY multiplied by the percent of supply utilized.
Andruu also pointed out that “understanding DeFi is really difficult with so much noise,” making data like this crucial for observers.
Collateralization ratio
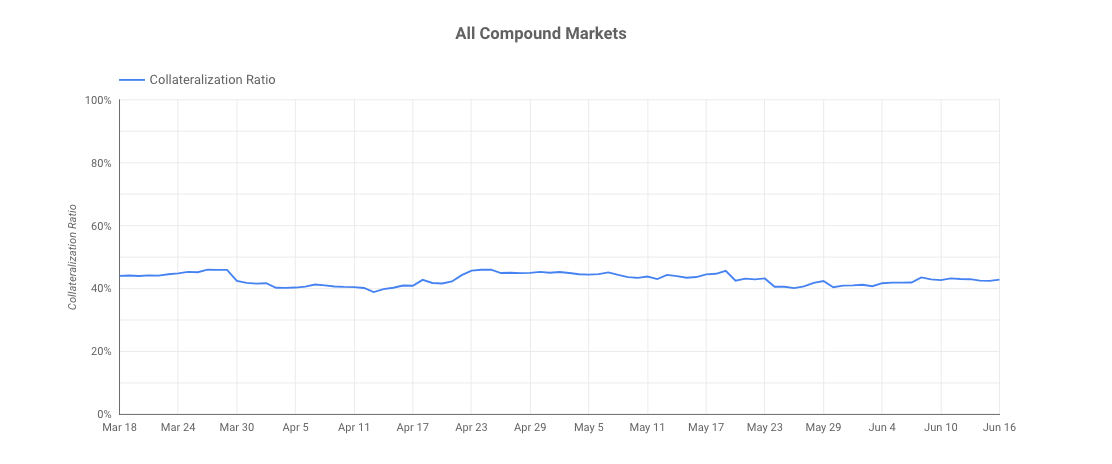
Next, we return to the work of @scottincrypto. This time, Scott looked to determine the collateralization ratio on Compound, or the relationship between borrowed and supplied capital.
As we can see in the graph below, Compound Protocol collateralization has remained steady over the past three months. The ratios for stablecoins have dropped since the May market crash, which could point to people deleveraging in response to falling collateral values to avoid liquidation.
Crash analysis
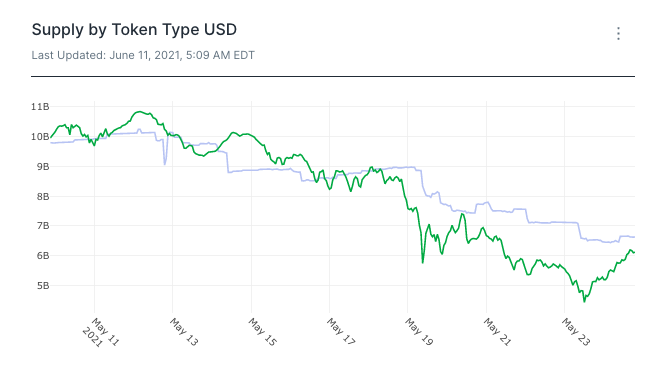
Continuing with @scottincrypto’s analysis, our next bounty offers a look at how May’s volatility played out on Compound.
As Scott notes, we can see that before the rapid falls of May 19, more than half of supplied collateral and more than 90% of supplied loans were denominated in stablecoins. This means that about 50% of the loan book on Compound suffered an increase in collateralization as a result of the May 19 drops.
Compound volatility
What else can we learn about volatility on Compound? As @scottincrypto shows in our next bounty submission, borrowing rates on Compound change constantly — and dramatically.
Looking back over the past sixth month, we can identify how many days we saw a change of more than 2% in the borrow APY. We can also examine the largest changes over the same time period to drill further into each case, as @scottincrypto did elsewhere in his submission.

Compound strategy
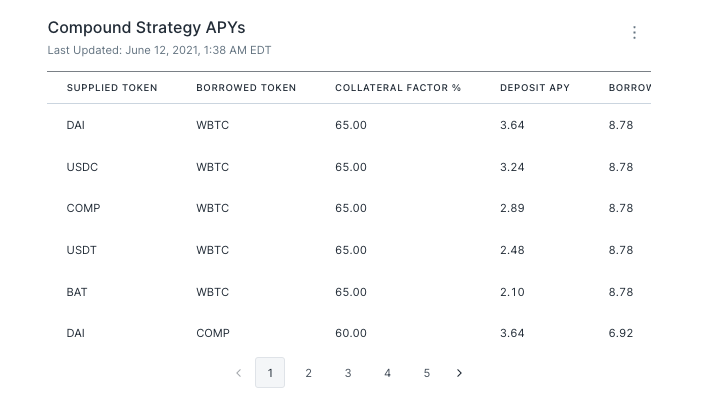
Between the recent crash and the high amount of volatility on Compound, what strategies should investors take? @scottincrypto offers an answer to that question as well.
In his analysis of Compound strategy, Scott offers a simple investment strategy, the APYs of which can be seen below. This strategy calls for investors to swap to tokens with high deposit yielding, add this to Compound, and take out a loan using the highest yielding borrow APY token.
@scottincrypto offers more details on the simple strategy, as well as a more complicated offering, so check out his Compound data here.
Get involved
That does it for this week. Thanks to everyone who submitted such great bounties!
As @scottincrypto pointed out “Flipside bounties are a great learning tool. Not only do you get to polish up your SQL skills, but you also get to deep dive into DeFi protocols and understand how they work.”
Want to get more involved with Flipside’s incredible community and see your own submissions on our blog? Make sure to join us on Discord, follow on Twitter, and subscribe to our newsletter, the Bounty Brief.